GA4 Reports for Nonprofits: Unlocking Insights With Classy Data

This blog was written by Luke Dringoli, VP of Technology at Media Cause and board member of the Madelyn James Pediatric Cancer Foundation. He is a respected thought leader in the digital marketing industry with over 14 years of experience and has spoken at events like INBOUND, the Nonprofit Technology Conference, and ActCON.
Clear, robust, and actionable data is the lifeblood of any nonprofit. If your organization can analyze how people interact with your website and fundraising efforts, when they take the actions you want them to take, and where they come from in the first place, you have the metrics you need to guide your work and grow your impact.
Google Analytics 4 (GA4), Google’s next-generation website analytics tool, is focused on tracking events and offering more advanced ways to analyze your website visitors’ user behavior and the actions each individual does or doesn’t take. Classy offers a native GA4 integration that is simple to set up and an advanced integration using Google Tag Manager that is infinitely customizable.
In this post, we’ll walk you through five custom reports to set up once you have GA4 running across your organization’s main website and Classy campaign pages.
GA4 Report #1: Donation Funnel Report
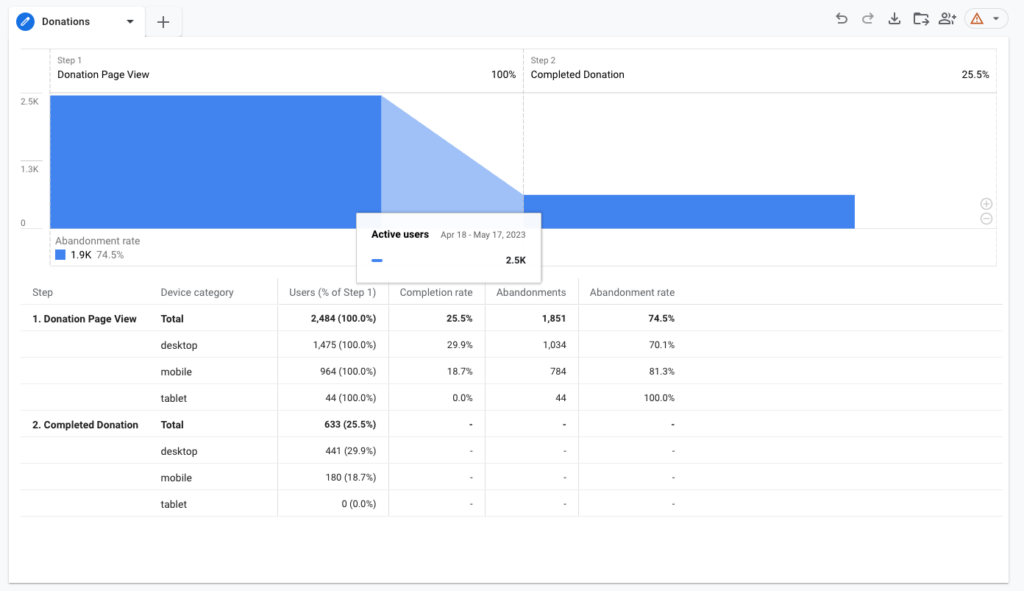
A donation funnel report is one of the most essential reports your organization can build. Simply put, it helps you understand how many visitors considered making a donation and how many of them followed through with it. Bookmark this report and check it often to understand the health of your Classy campaigns’ conversion and user acquisition rates.
Steps
- In your Google Analytics 4 account, click Explore in the left-hand navigation bar.
- Select Funnel exploration from the list of templates at the top of the page.
- Under Steps, remove each default step and click the edit button to create a new step for each stage of your donation funnel.
- Name Step 1 Donation Page View and select Page title as the event.
- Select + Add filter and set it to contains > “Donate to” for all Classy donation form pages or “Donate to [Campaign Name]” to measure a specific Classy campaign’s donation form.
- Note: Ensure there aren’t pages on your main website containing this same page title. If there are, you must rename them or use the Page path + query string event instead.
- Name Step 2 Completed Donation and set the event to purchase.
- Note: Ensure that you aren’t using the Monetization feature of GA4 to track other purchases besides Classy (such as for an online store). If you are, you will need to add a parameter based on item_name
- Select APPLY to view your finished Donation Funnel report. Adjust the timeframe as needed, and customize the table below the chart using the Breakdown section for a more detailed view of completions and abandonments.
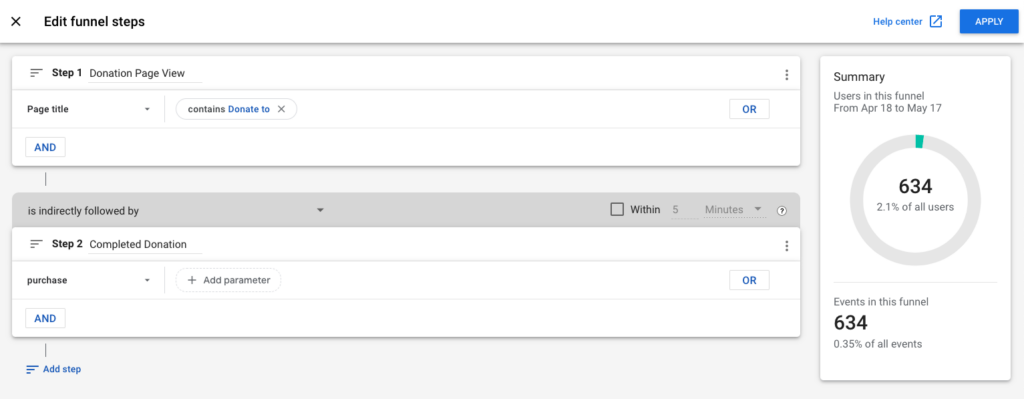
Pro Tip: Switch the Visualization type to a Trended funnel to see how effectively your Classy campaigns have driven donations over time. Click on each tab above the graph to better understand each funnel stage.
GA4 Report #2: Donor Explorer Report
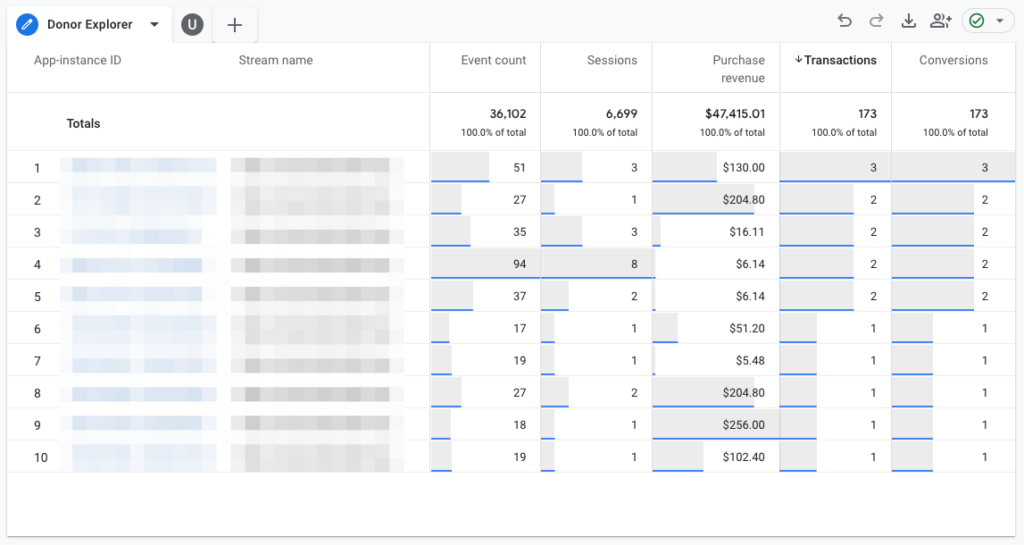
The Donor Explorer report is a modified version of the User Explorer report that allows you to dig into individual, anonymized active users who have given to you using Classy. By sorting the information by the Transactions or Purchase revenue columns, you can view individual donors who have given multiple times or a considerable total amount and see each conversion event on their path to checkout.
Steps
- In your Google Analytics 4 account, click Explore in the left-hand navigation bar.
- Select Template gallery and choose User explorer from the list.
- Rename the main tab of your report as you wish by clicking on the default text user explorer 1.
That’s it! Start by sorting your data collection based on what sort of donor you are looking for. Clicking on an individual App-instance ID will pull up a full-page overview report of the user and a chronological timeline of their events.
Pro Tip: Click the Purchase revenue and Transactions columns to sort the users (“App-instance IDs”) based on total lifetime value (LTV) and number of donations, respectively. This helps isolate high-value users and understand their path to giving.
GA4 Report #3: Donor Cohort Report
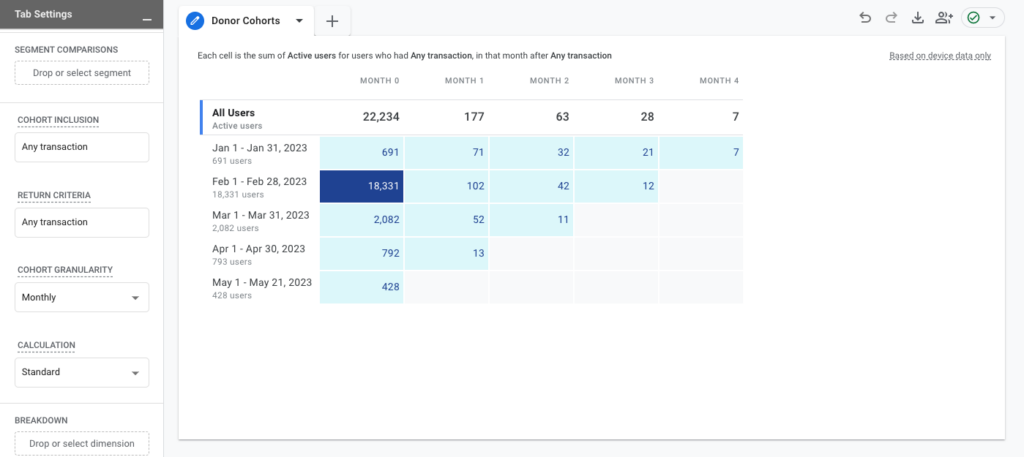
That’s where Google Analytics 4’s Cohort Exploration report comes in. It’s a template that organizes donors into daily, weekly, or monthly cohorts and analyzes how many go on to make additional donations. This functionality allows you to quickly understand how strong your program’s retention rate is and if your donor lifecycle strategy is effective.
Steps:
- In your Google Analytics 4 account, click Explore in the left-hand navigation bar.
- Select Template gallery and choose Cohort exploration from the list.
- Rename the main tab of your report as you wish by clicking Cohort exploration 1.
Pro Tip: Use the Breakdown option to get more granular with the results. Try First user source to see how effectively various sources generate donors that give multiple times.
GA4 Report #4: Donor Lifetime Value Report
Google Analytics 4 can calculate the average lifetime value of a site visitor and break that down by how they first arrived at your site. This dovetails nicely with how nonprofits analyze donors and can play a valuable role in quantifying the value of each visitor to your site and, by extension, the value of your site (and Classy campaigns) overall.

Steps:
- In your Google Analytics 4 account, click Explore in the left-hand navigation bar.
- Select Template gallery and choose User lifetime from the list.
- Rename the main tab of your report as you wish by clicking on the default text User lifetime 1.
Pro Tip: Click on the box below ROWS to filter the data by First user medium, source, and campaign, as well as Last audience name and First visit date. Use these breakdowns to understand the difference in lifetime value for each donor entry point and invest more in the sources that drive the best long-term outcomes for your program.
Remember that the data presented is bound by the date range you select. We suggest using the longest timeframe possible, which will come down to how long your organization has been using GA4. That way, the greatest amount of data goes into the values shown. You could also view the data year-to-date based on your fiscal year. It’s not going to be as comprehensive as a LTV analysis of your first-party data, but it will offer a sense of how well your site is driving LTV relative to total visitors.
GA4 Report #5: First-Party Data Report
Ok, we tricked you. Our final recommended report is a reminder that the best reporting is based on the data dashboards only you have access to. In other words, the data in your Classy account.
Your subscription to Classy comes with reporting for transactions, recurring giving plans, fundraising pages, and more. While Google Analytics 4’s reporting templates are powerful, they should be viewed as directional and not 100% accurate since privacy features can block the GA4 script. Because of that, it will never be “apples to apples” with the data in your Classy account, which should be viewed as the ultimate source of truth when reporting your results.
The ideal scenario is to use both third-party analytics tools such as Google Analytics 4 and your Classy account’s reporting features to tell a macro and micro-level story about the health and success of your fundraising efforts. To do so, you should apply both UTM Codes and Classy Source Codes to URLs pointing to Classy campaign pages.
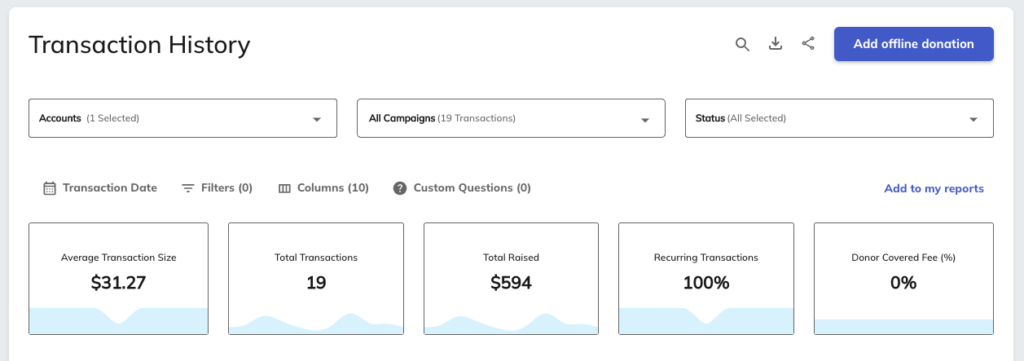
Pro Tip: When building a Transaction report in Classy, make sure to use the Columns section to add Source Code 1, Source Code 2, and Referrer to your report. You can find them under the Marketing section. Just keep in mind that these fields are not available on other reporting types, such as Recurring Giving Plans.
Additionally, if you manage multiple Classy accounts (such as a chapter-based organization), you can use the Accounts dropdown to produce “rollup” reporting on your results.Use the “Add to my reports” feature at the top-right of Classy reports to add a shortcut in the My Reports section of the General Reports tab.
The Value of Connected Technology In Nonprofit Fundraising
Connected fundraising requires your organization’s front-end and back-end experiences to work together to facilitate unified donor journeys. A truly connected experience is streamlined from end to end, and reflects the personal needs and interests of each individual.
With access to clean, comprehensive data, you’re able to achieve a fundamental understanding of how new users and existing donors engage with your organization, opening the door for your team to turn that moment of generosity into a lifelong relationship.
Understanding who those highly-engaged supporters are, which channels they prefer, and how to reach them is only possible with connected technology. A set of comprehensive fundraising tools paired with best-of-breed integrations makes it possible to facilitate, organize, and oversee all donor interactions without losing anything in the shuffle.
Hear directly from Jarrett OBrien, Classy’s VP of Product Marketing, how Classy is applying the concept of connected fundraising to its technology and what our rate of innovation means for nonprofits worldwide.

Explore Classy's Integration With Google Analytics 4
Subscribe to the Classy Blog
Get the latest fundraising tips, trends, and ideas in your inbox.
Thank you for subscribing
You signed up for emails from Classy
Request a demo
Learn how top nonprofits use Classy to power their fundraising.


